Why You Can’t Measure If Your Design Works

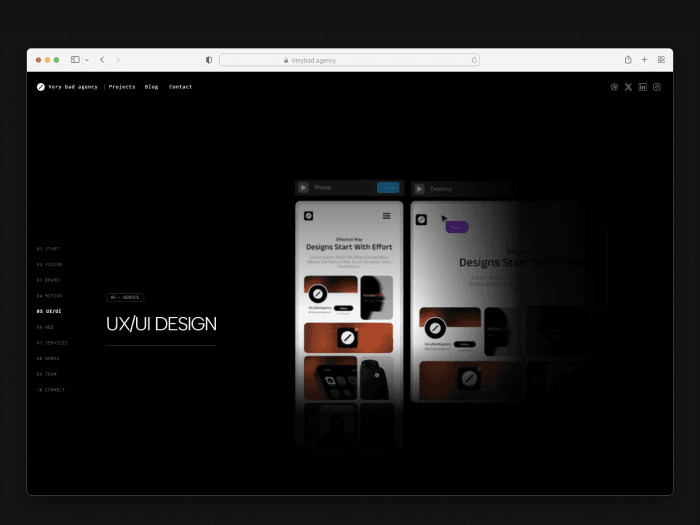
UX/UI Designer exploring the edges of digital clarity and creativity. Co-founder of Very Bad Agency – Digital Pharmacy, where bold ideas meet honest design. I write about interface thinking, creative process, and building brands that actually mean something. Currently exploring new ways to communicate visually — through motion, interaction, and unconventional design methods.
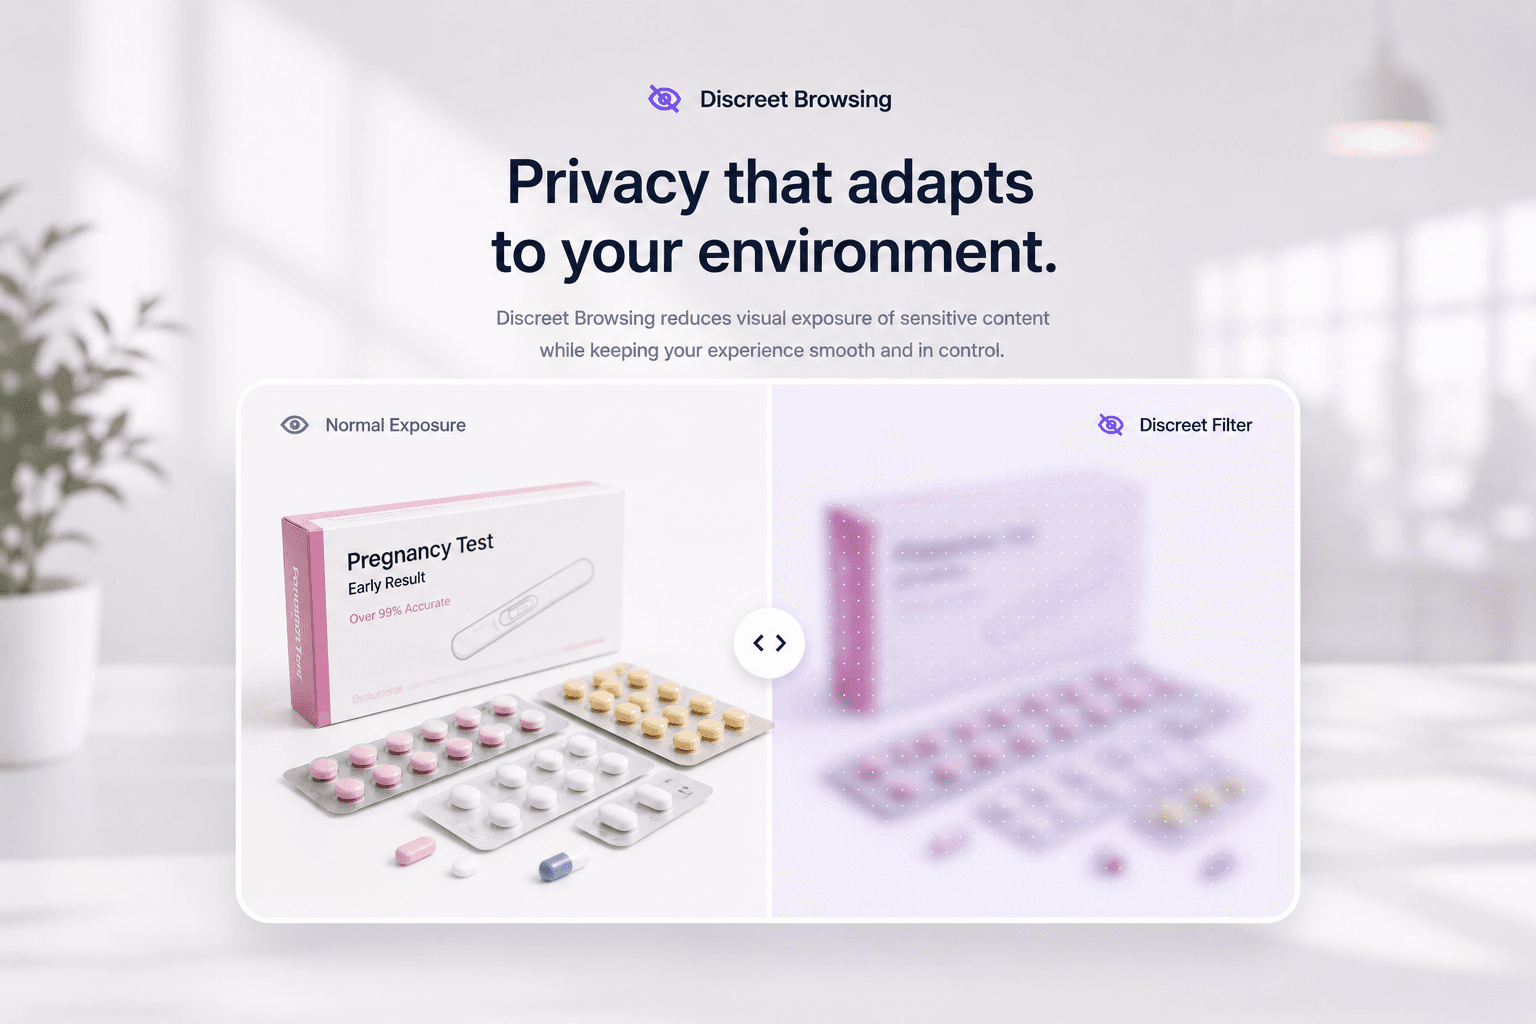
Fancy UI isn’t UX. Real UX leaves evidence.

Fancy UI isn’t UX. Real UX leaves evidence.
[Photo content: abstract heatmap or blurred analytics dashboard]
Most teams say they “care about UX.”
Very few can prove it works.
Design reviews are full of opinions.
Stakeholders vote.
Designers defend.
Someone says, “Users will like this.”
And then the product ships — without a single baseline, index, or success metric.
If you can’t measure how your design changed user behavior, you didn’t design UX.
You designed a guess.
UX Is Not an Opinion. It’s a Result.
UX does not live in Figma.
UX does not live in Dribbble shots.
UX does not live in presentations.
UX exists after release, when users interact with your product under pressure, distraction, and zero patience.
If nothing changed in how users behave, decide, or complete tasks — UX did not improve.
“Looks better” is not a UX outcome.
“Feels cleaner” is not a UX metric.
Real UX answers only one question:
Did user behavior change in a meaningful way?

Why Most Teams Can’t Measure UX
Not because they don’t have tools.
Because they don’t have clarity.
Common failures:
No baseline before redesign
No definition of “success”
Metrics chosen after launch
Engagement confused with understanding
Tools used without interpretation
Teams collect data, but don’t ask the right questions.
If everything is a metric, nothing is insight.
The UX Indexes That Actually Matter
Vanity metrics don’t measure UX.
Indexes do.
These are the signals that reflect real user experience:
Task Success Rate
Can users complete what they came to do?Time on Task
Not speed — clarity. Confusion slows people down.Error Rate
Misclicks, form failures, dead ends.Drop-off Points
Where intent disappears.Rage Clicks
Frustration disguised as interaction.Scroll Depth vs Action
Scrolling means nothing if users don’t act.Return Behavior
Do users come back without being pushed?
UX is found in patterns, not single numbers.

Tools Don’t Do UX. People Do.
Hotjar.
Microsoft Clarity.
FullStory.
GA4.
Maze.
UsabilityHub.
All useful. None magical.
A heatmap without context is just modern art.
Clicks don’t equal intent.
Sessions don’t equal success.
Tools show what happened.
UX thinking explains why it happened — and what to change.
Used wrong, research tools create confidence without truth.
Used right, they expose uncomfortable reality.

Sources & References (Real UX Case Studies)
1. Baymard Institute — Cart Abandonment Research
In-depth e-commerce UX data showing how specific UX issues drive shopping cart abandonment and affect revenue.
🔗 https://baymard.com/lists/cart-abandonment-rate
2. Google Web Vitals — UX Performance Metrics
Official documentation and research on Core Web Vitals and how performance affects user behavior and business outcomes.
🔗 https://web.dev/vitals/
🔗 https://web.dev/why-speed-matters/
3. GOV.UK Service Manual — Measured UX Improvements
UK government’s design system and service standards with evidence of improved task completion and reduced support costs.
🔗 https://www.gov.uk/service-manual
4. Microsoft Clarity — Behavior Signals (Rage Clicks)
Documentation and insights on how rage clicks and other behavior signals can reveal UX frustration points.
🔗 https://learn.microsoft.com/en-us/clarity/
5. Nielsen Norman Group — How Users Read on the Web
Research on scanning patterns, visual hierarchy, content comprehension, and user reading behavior.
🔗 https://www.nngroup.com/articles/how-users-read-on-the-web/
6. NN/g — UX Metrics Best Practices
Guidance on meaningful UX metrics and how to measure task success, error rates, and behavioral outcomes.
🔗 https://www.nngroup.com/articles/ux-metrics/
7. Baymard Institute — Form Usability Findings
Detailed findings on form design issues and how they affect completion rates — useful for real UX measurement.
🔗 https://baymard.com/research/form-usability
8. Google — Search and UX Research (User Behavior)
Broad UX research and best practice insights from Google’s UX teams and behavioral studies.
🔗 https://research.google/teams/brain/ux/